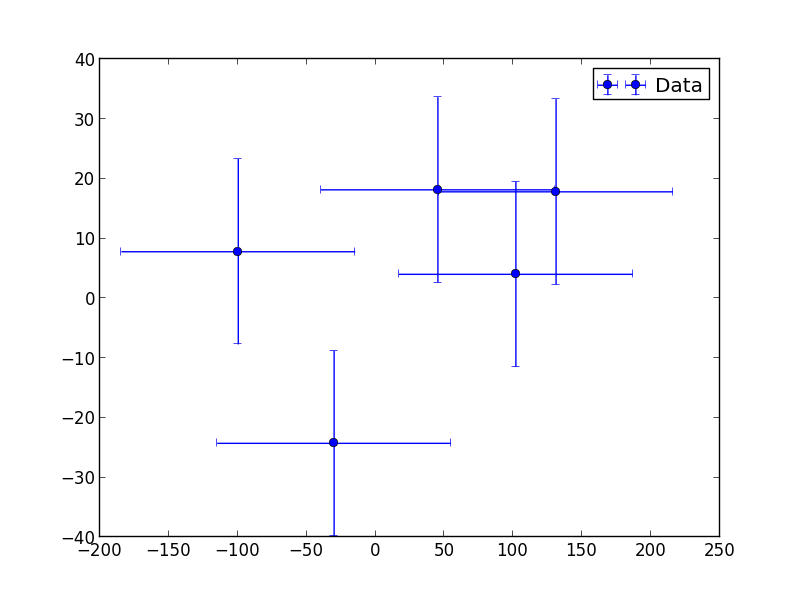
Matplotlib by default includes errorbars in the legend on top of whatever symbol is being used. I think this makes the legend look really messy, so wanted to remove it and simply plot the symbols. Here is a legend with errorbars included:
import matplotlib.pyplot as plt
import numpy as np
from numpy import random

#make some toy data
x = random.normal(scale=100, size = 5)
y = random.normal(scale=15, size = 5)
x_err = np.std(x)
y_err = np.std(y)

plt.errorbar(x,y,y_err,x_err,fmt='bo',label='Data')
plt.legend()
plt.show()
The simple way fix this is to double plot the data, with the errorbars on top, but only label the non errorbar plot:
import matplotlib.pyplot as plt
import numpy as np
from numpy import random

x = random.normal(scale=100, size = 5)
y = random.normal(scale=15, size = 5)

x_err = np.std(x)
y_err = np.std(y)
plt.scatter(x,y,c='b',marker='o',label='Data')

plt.errorbar(x,y,y_err,x_err,fmt='bo')
plt.legend()
plt.show()
This works fine, but is very un-pythonic, and feels like a bad way to do this for large datasets. So lets do it properly by removing the line objects from the legend objects:
import matplotlib.pyplot as plt
from matplotlib import container
import numpy as np
from numpy import random


x = random.normal(scale=100, size = 5)
y = random.normal(scale=15, size = 5)

x_err = np.std(x)
y_err = np.std(y)

plt.errorbar(x,y,y_err,x_err,fmt='bo',label='Data')

ax = plt.gca()

handles, labels = ax.get_legend_handles_labels()

new_handles = []

for h in handles:
    #only need to edit the errorbar legend entries
    if isinstance(h, container.ErrorbarContainer):
        new_handles.append(h[0])
    else:
        new_handles.append(h)

ax.legend(new_handles, labels)
plt.show()
This gets the artists for each item in the legend, handles. For each errorbar
object, the first item, handles[0] corresponds to the symbol, and the other items
correspond to the errorbars. So by looping through all of the items in the legend,
and using isinstance to check for errorbar objects and building a new list for handles
new_handles which contains unmodified artists for non-errorbar objects and only the
symbol for errorbars themselves.
That’s quite a lot of code to do a simple thing, and I’d rather not create a second list. So, lets tidy this up and use a ternary operator to make this a bit more streamlined:
handles, labels = ax.get_legend_handles_labels()
handles = [h[0] if isinstance(h, container.ErrorbarContainer) else h for h in handles]

ax.legend(handles, labels)
plt.show()
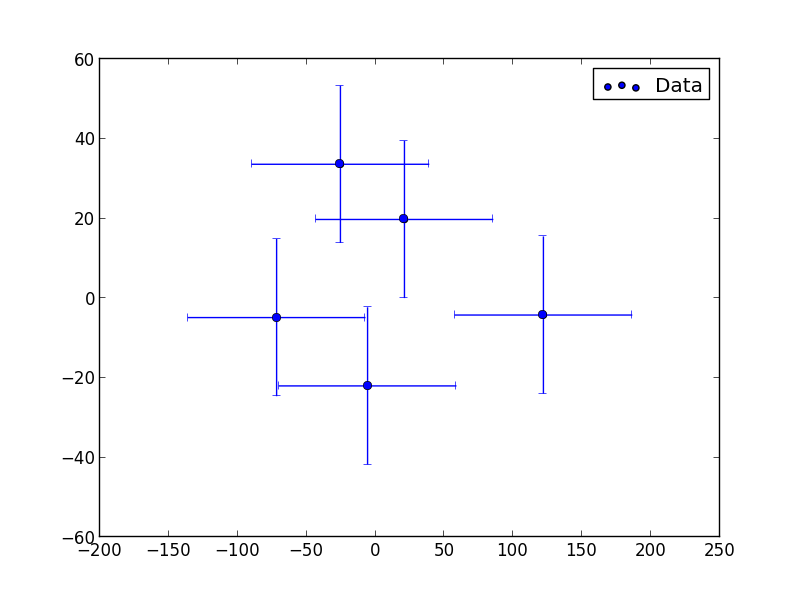
The final fixed legend looks the same all of these methods:

