
Here is a quick remider of how to place a legend in a matplotlib plot.
The pyplot.legend() method takes the argument loc which corresponds to a
position on the plot. 0 chooses the best location based on where
the data is plotted. The example plot below shows where a legend will be placed
for each value of loc:
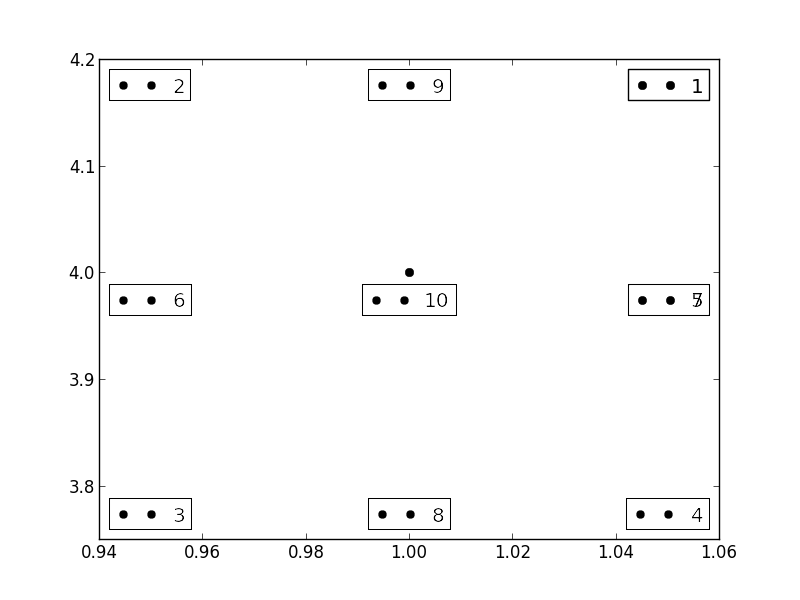
Interestingly, values 5 and 7 both correspond to the same location.
You can also pass loc a tuple of x,y coordinates in axis units, if you need precise placement, check out the docs for more info.